Charting Enhancements
Introduction
The Chart object allows you to create and format a wide variety of charts, including radar, waterfall, stacked permutations of Bar, Line, Area, Doughnut, Scatter charts. These objects change the way the User may interact with information and data series. They are highly interactive, providing features such as zooming and master layout, as well as drill-down and interactive selection.
Hereafter some examples of new data visualization:
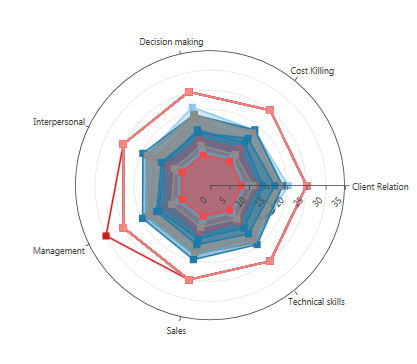
A Radar Chart sample to dashboard the Employee Skills
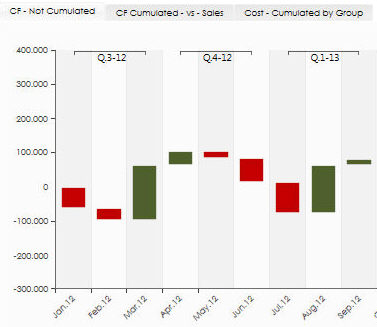
A Waterfall Chart to Visualize Cash Flow Trend
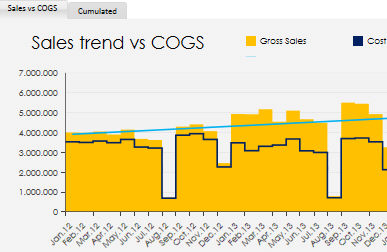
A combo Chart with Linea, and Area Series Options