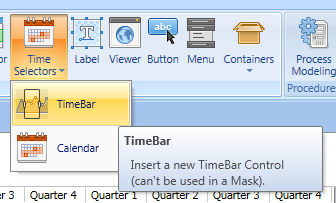
The Timebar Control is a smart Time Selector combined with an Area Spark-line.

Dragging the Window (Grey Rectangle) , that scrolls on the Time-bar Time Range it is possible to ignite in the Screen a given Time Select to focus on the Sparkline Peaks : in this way you can first, at a glance analyze the series time behaviors and then run an in depth analysis using data-view and charts using the proper Time Selection (from the Time Bar).
The available Time dimensions are : Year >Quarter>Month>Week>Day
The visualization Level is automatically detected from the Layout setup (Time entity by row), and it is adopted to display the Sparkline.
Click on Time Selectors icon and drag & drop into your screen the Timebar Object

Right click on the object to open layout and insert Data you need
Setup the Axis accordingly to the Time granularity you like.

The Timebar can display the Screen Time Range or a wider Time Range when the Show Inactive Member Option is active. When the Screen is prompted the Timebar shows the entire Range and the Windows highlights the Screen Time Selection.
|
The Window can now be shifted back ad forth. |
|
The Window can be widen on the left or on the right. |
|
You can also Zoom-In and Zoom-Out using the Mouse Rolling button and/or apply a more accurate selection once the time items are available. |
Once the mouse is released the new Time Selection is applied to the Screen.