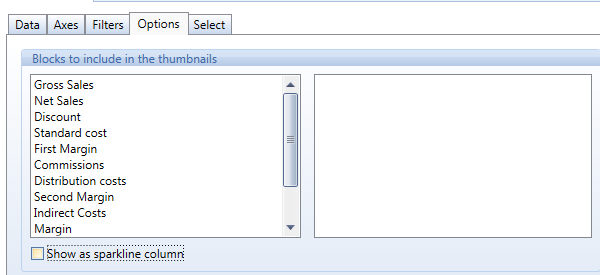
In the Dataview Options Tab, drag and drop the Layout blocks you like to visualize like Thumbnails in the Data View. Thumbnails Pop Up is prompted out when the User is hovering the mouse on any Item by row. The Thumbnail Chart visualizes the Blocks using the entity by column in the X-Axis and selecting data accordingly to the Item by row.

When the "Show as sparkline" option is activated the little charts defined for each row of our dataview are visualized like Dataview columns.
The chart can be of two different types:


Sparklines will appear before data in each row, hovering the mouse on them we'll have a zoom of the single Sparkline chart containing further details.
You can set up more than one block as Sparkline.
Note:
Sparklines won't be shown when printing the DataView. Sparklines are not supported on the WebClient.