The procedure designer has been improved with some features to support tracing and debugging procedures.
It is possible to
set a breakpoint which halts execution of the procedure at a given line and while the procedure is halted,
open a Watch window allowing to view the Select which is active at that point of the procedure,
and run a Layout to view the content of an InfoCube.
The debugger then allows to resume execution of the procedure either step by step or on to the next breakpoint.
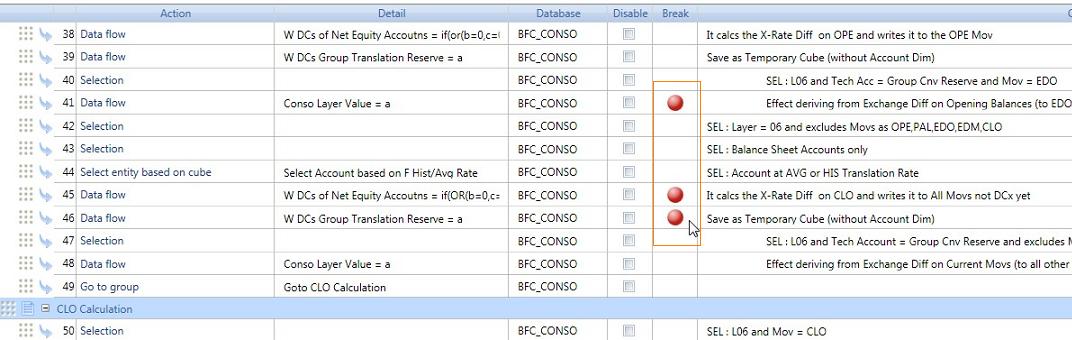
To set a breakpoint, click on the Break column at the desired step where the procedure should halt.
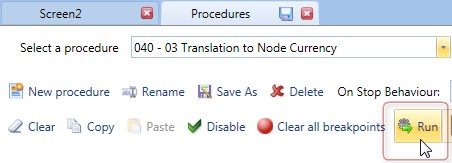
The procedure can be launched from the Procedures Designer environment by clicking the Run icon,
When the procedure stops at a defined breakpoint, the Watch window will automatically open, as in the example hereafter.
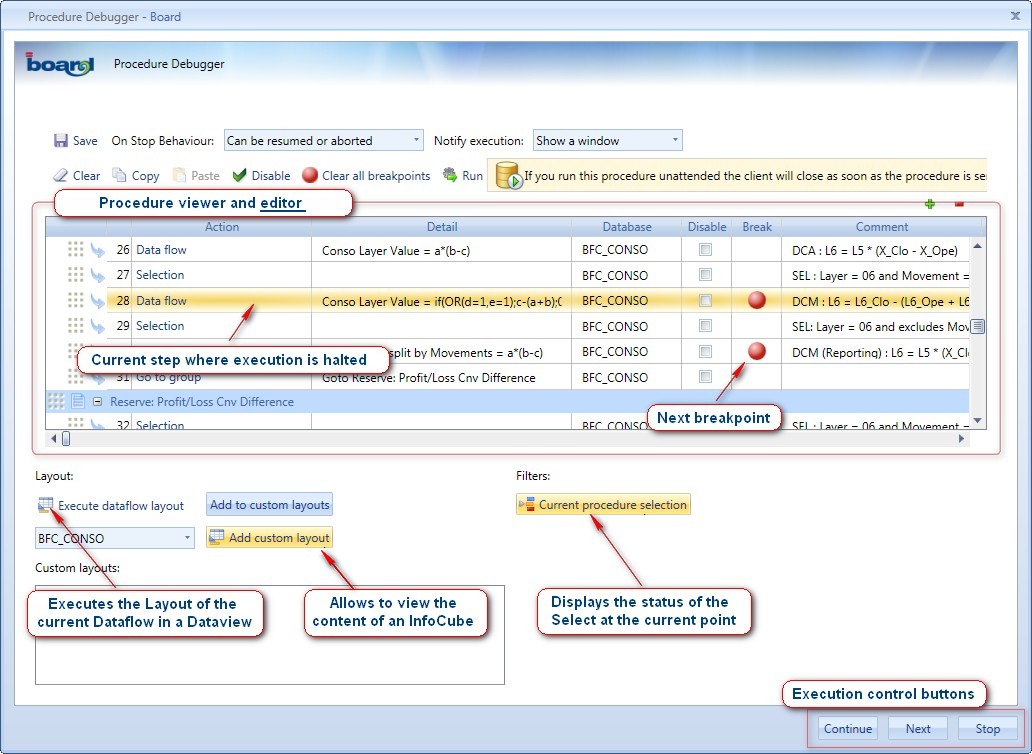
The point where the procedure is halted is highlighted in amber. Note that the step where the procedure is stopped is not yet executed.
It is possible to edit the procedure while execution is halted.
To view the selection currently active, click on the Current procedure selection button.
To view the content on an InfoCube, click the Add Custom layout button. If the procedure is stopped on a Dataflow step, it is possible to run a Dataview having the same Layout of the dataflow simply clicking the Execute dataflow layout button.
To run the current step where execution is stopped and stop at the next action, click the Next button. To resume execution of the procedure (until the next breakpoint is found) click Continue, and to stop the procedure click Stop.