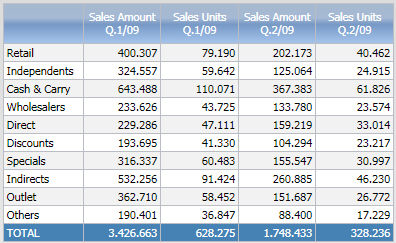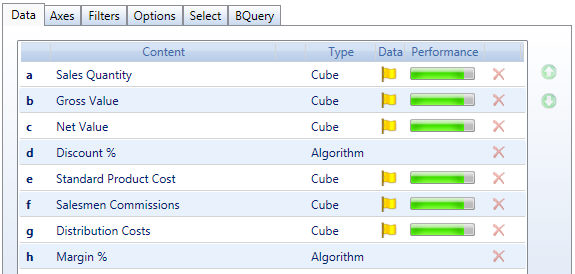
The Data tab of the Layout defines the blocks (or columns) of the query. The data blocks of a Layout define the information of the query and the Axes define the view of the query. For example a query displaying sales amount and sales units per quarter and channel (see image below) is the result of a Layout with two data blocks, Sales Amount and Sales Units and the Channel dimension per row and Quarter dimension per column.
Example of a report with two data blocks.

A block of the Layout can be
a cube: select the desired cube from the Data selection drop-down list
calculated column: type the formula in the Column algorithm field.
an entity: select the entity from the Entities & Relationships drop-down list
a ranking function, which are predefined algorithms for ranking analysis: select the desired function from the drop-down list
a Rule : select the desired rule from the drop-down list. Rules are formulas that calculate the value of an entity member from other members of the same entity (refer to Database Rules for details). The selected rule is applied on the values of the preceding data block.

On each data block, additional optional settings can be defined, such as for example the column heading, the number of decimals, traffic-light alerts (i.e. red and green conditional coloring) and other options explained in following paragraphs.
Each blocks is identified by a letter, displayed in the row header, which is then used to formulas.

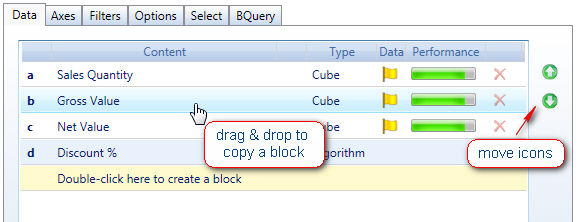
To add a block, double-click on the yellow row,

To copy an existing block, click on the block to copy then drag and drop it onto another block or on the yellow line (to add a new block). To move blocks, use the up/down arrow icons on the right.
