To configure a Cockpit object,
Select the Cockpit icon from the Toolbox then drag and drop it on the Capsule screen.
Right click on the object and configure a Layout as required. The cockpit indicator (needle or thermometer) will represent a numerical value from the Layout (a cube or a calculated column).
then go to the Options tab of the Layout and select the block show in the cockpit, drag and drop it in the Selected Block field.

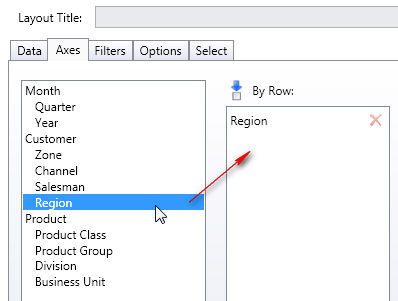
in the Axes tab, set an entity By Row: one indicator for each element of this entity will be plotted

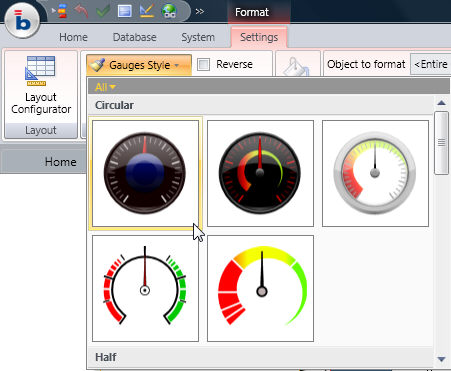
to choose the style of the cockpit object, select one of the available types from the Gauge Style menu option,

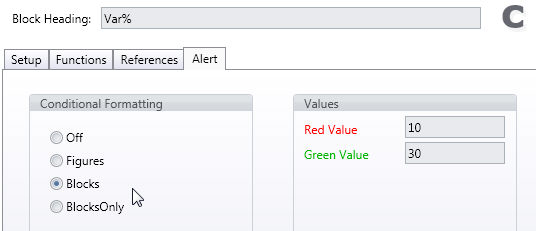
to define the range of the indicators go to the Alert tab of the block selected in the cockpit,

for the angular and thermometer indicators the red and green alert values represent the minimum and maximum value of the range,
for the alerts indicators (squares or circles) the red alert determines the threshold under which the indicator is colored in red, and green alert determines the threshold over which the indicator is colored in green, values within the two thresholds are colored in amber.