The bubble chart object provides the following interactive features,
Bubble information tool-tip
Zoom
Select
Master Layout
Drill-down
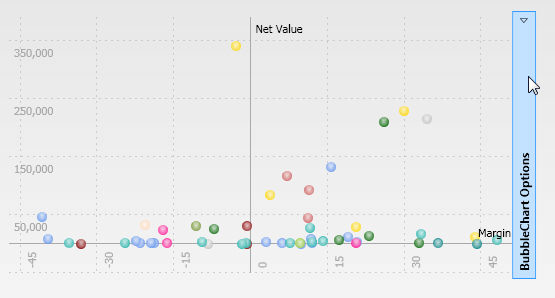
To access the interactive user features, place the mouse over the bubble chart, then click on the blue bar which automatically appears on the right side of the object.
To collapse the tools panel click again on the blue bar.

Placing the mouse pointer over a bubble opens a pop-up window displaying the values relating to the bubble item and, in case the Layout has two entities set by row, highlights all bubbles belonging to the same group.

Note
The option Print Bubble Label located in the Ribbon Bar, allows to print the bubble labels (i.e. the name of the entity member represented by the bubble).
There are two ways to zoom, on an area of the bubble chart,
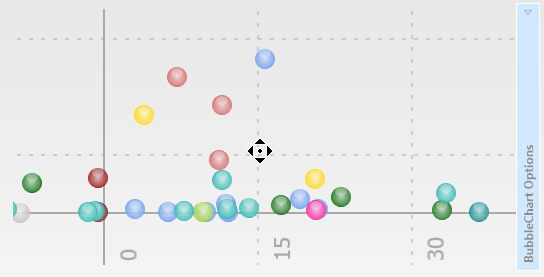
use the mouse wheel: roll down to zoom-in, or roll up to zoom-out. To move the zoom area, set the pointer option to Move
then click on the chart and drag the mouse to move the chart as shown.
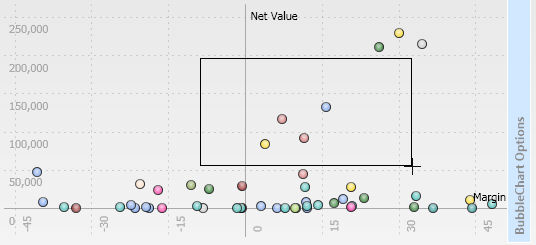
or set the pointer option to Rubber Band
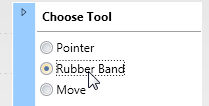
then capture the area of the chart to zoom-in on,
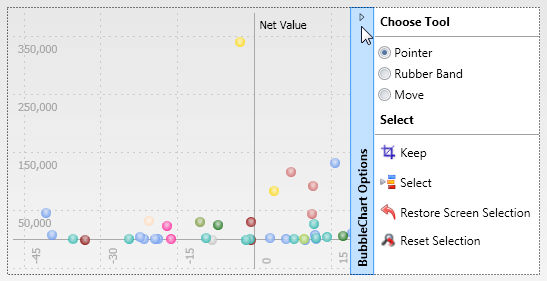
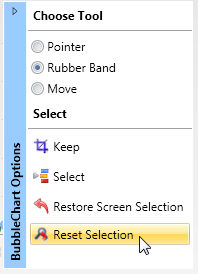
To zoom-out, open the tools panel and click the icon Reset Selection
After zooming-in on an area of the bubble chart, it is possible to capture bubbles into the screen selection: open the tools panel and click on Select.
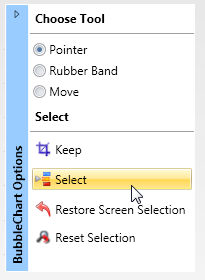
all other objects on the screen will be refreshed accordingly. You may open the screen Select object to view the selected entity members.
To restore the original selection of the screen, click the option Restore Screen Selection.
A bubble chart object can be defined Master: open the settings menu of the chart and enable the master option. Clicking on a bubble will then refresh the data displayed by all other objects of the screen, with a restriction to the item clicked.
When the Master option is enabled, the drill-down function is disabled.
To drill-down on a bubble, double click on it or right-click on it. Make sure the pointer option is set to Pointer. When the bubble chart is defined as a Master object the drill-down function is disabled.