Additional Analysis
The ADDITIONAL ANALYSIS macro-phase is composed by three sections:
Through this screen the user has an overview of the total sales amount per groups.
At a glance, the user is able to identify the contribution to the total sales amount for each single group, identifying the groups that contribute for the most or for the less.
Through the master function, selecting a group from the pie chart, the two dataviews will refresh showing only the data relate to the group chosen.
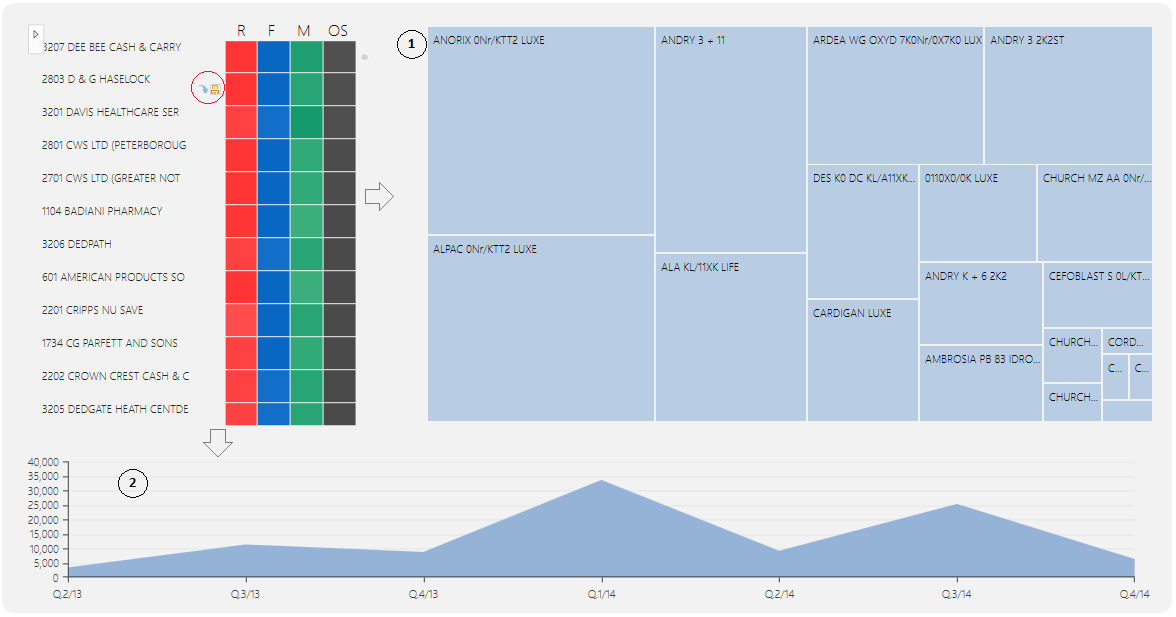
In this section it is possible to analyze, for each customer, the product portfolio and the sales amount by product.
Starting from the heatmap, that recaps the customer recency, frequency, monetary and overall score, using the master function, the user concentrates the analysis on the customer selected.
Automatically the treemap (1) and the below chart (2) will refresh, displaying only the data referred to the customer chosen.

For the customer selected with the master function:
> The treemap (1) collects all the products purchased, the size of the square stands for the sales amount. The more the square size the more the product sales amount.
> The chart (2) shows the sales amount trend across a time range.
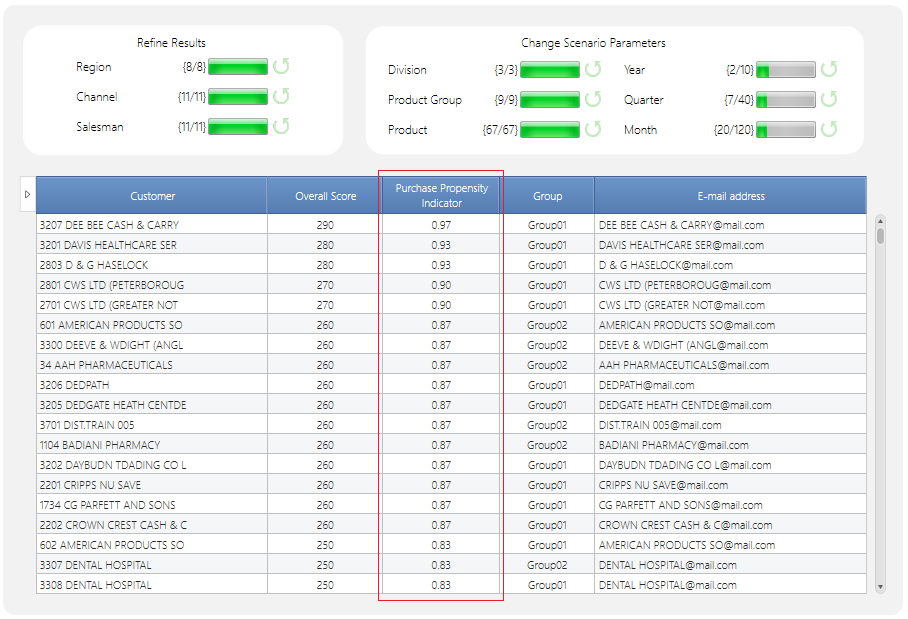
In this section it is analyzed the Customer Purchase Propensity.

The user has the possibility to Change the Scenario Parameters and Update the results or Refine the current analysis.
The dataview shows for each customer the Overall Score, the Purchase Propensity Indicator, the cluster and the customer e-mail address.
The purchase propensity indicator is included between 0 and 1 and reveals the customer inclination to buy. The more this indicator is close to 1 the more the purchase from that customer is likely.